Mapping Opportunity in Northern Virginia

Using the interactive map:
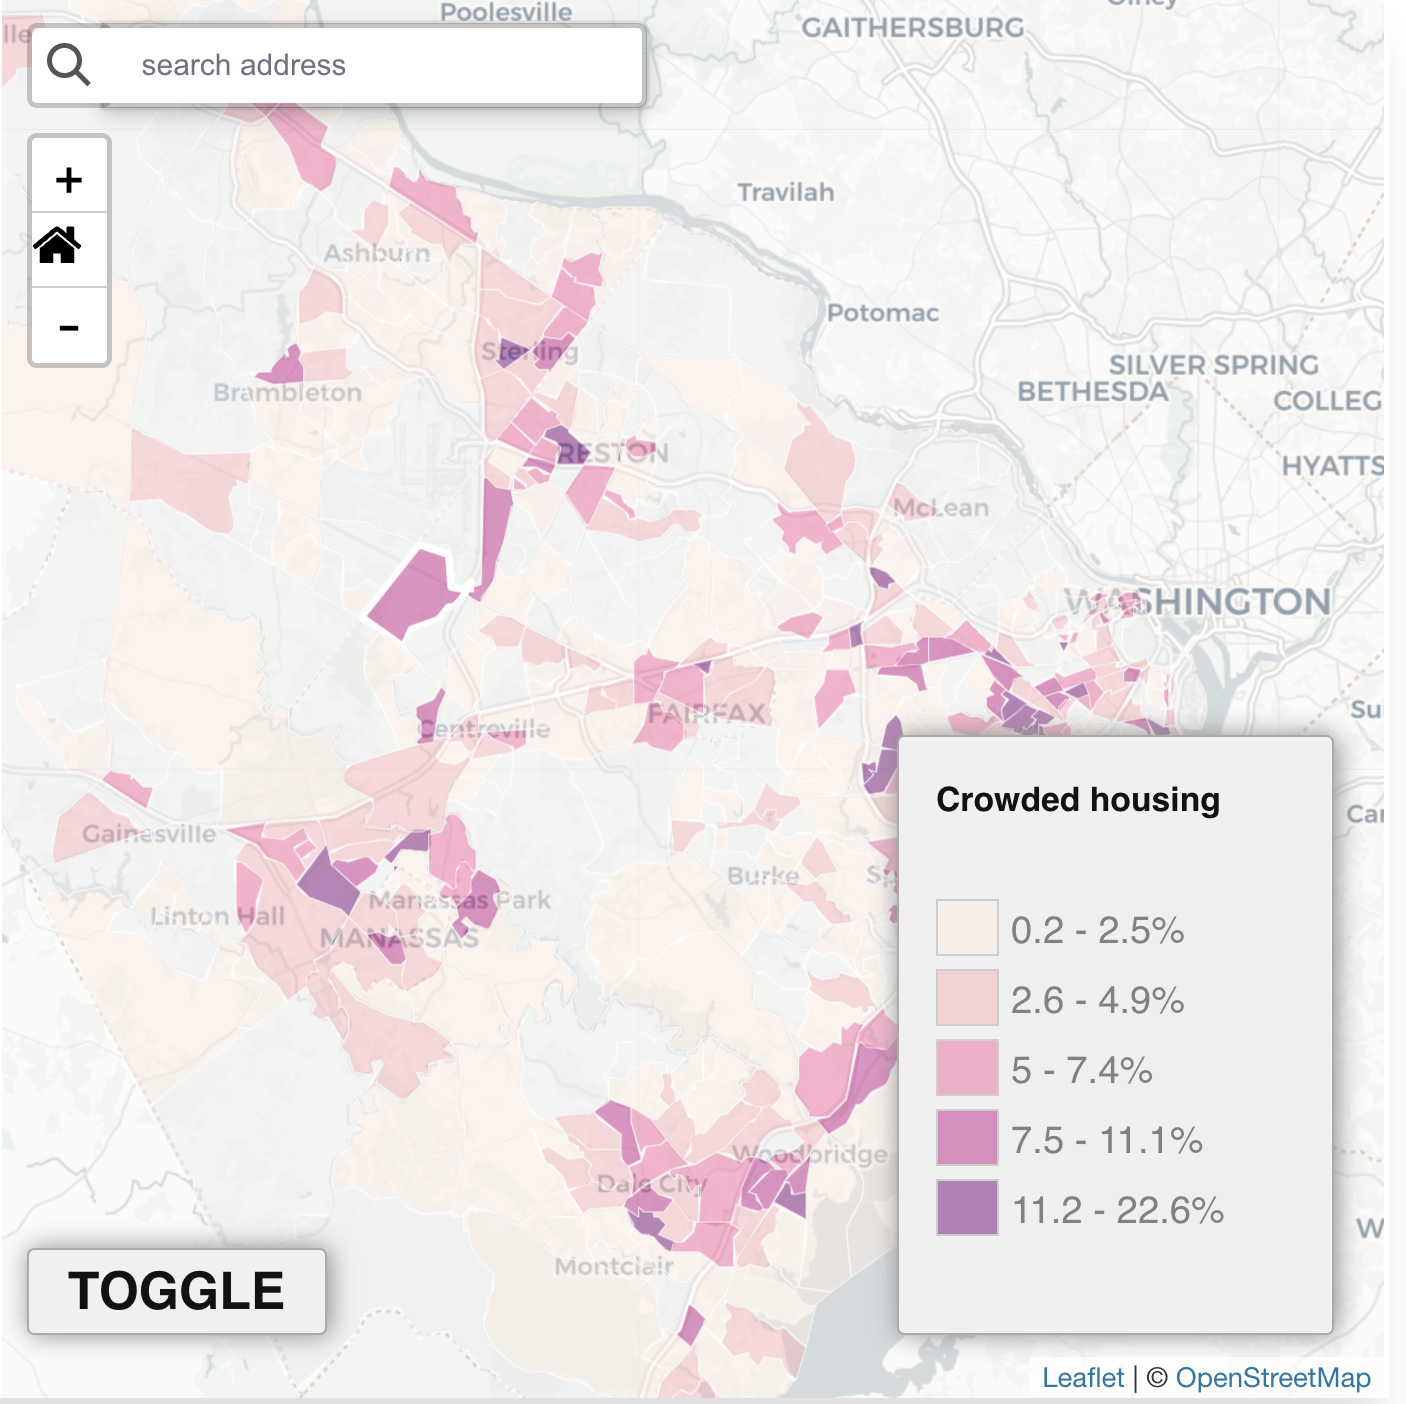
Select one or more of the factors from the list below to view on the map.
Click on an area of the map to see data for that location (data will display in the chart).
Click the “Toggle” button to cycle through maps of other factors highlighted on the chart.
Note: White areas on the map indicate tracts for which there was not available data or population counts were insufficient to calculate reliable numbers.
NEW! This map now includes a new indicator, the Premature Mortality Rate. This measures the number of deaths before age 75 that occurred between 2015-2019.
The Uneven Opportunity Landscape in Northern Virginia
Read the NVHF-commissioned report, Lost Opportunities: The Persistence of Disadvantaged Neighborhoods in Northern Virginia, to get a better understanding of the implications of these data and to explore recommendations for charting a healthier, stronger region for all.
Understanding Death Rates
Premature mortality rates are defined as the number of deaths that occur each year per 100,000 persons in the population, which we adjust for age. Put simply, people facing higher premature death rates live with a greater risk of dying before age 75.
We often report rates per 100,000 even for places with fewer than 100,000 persons. This is much like the way we use percentages in daily life. A sales tax of 6% (in which a tax of six cents is applied per dollar in sales) is applied to all products, even if they cost less than one dollar.
If five deaths occur in census tract A, with a population of 1,000 people, the death rate experienced by that population is 5 per 1,000, which equals 500 per 100,000. If census tract B experiences 40 deaths but has a larger population (10,000 people), it experiences more deaths but a lower death rate (400 per 100,000). Using a common denominator allows us to recognize when places and populations in Northern Virginia face a greater risk of dying prematurely.